Navigating future trends with precision through automatic time series forecasting
Navigating future trends with precision through automatic time series forecasting

Forecasting often deals with time series data. A time series is a sequence of datapoints in time order, such as monthly sales or daily sales. Time series often contain trends and seasonal variations. Sometimes these patterns are obvious and can be detected by the naked eye alone, but often they are obscured by random noise. Automatic time series forecasting can find and analyze such patterns. As businesses navigate the complexities of market dynamics, the significance of automatic time series forecasting cannot be overstated.
Automatic forecasting unveils hidden patterns
Traditionally forecasting is done as manual work based on expert knowledge. However, this can take a lot of effort and sometimes there just is not enough information for anything other than guessing. The use of automatic time series forecasting algorithms allows us to generate forecasts based on patterns hidden in historical data. In this way, high-quality forecasts can be generated automatically and quickly, even for massive datasets.
The required data can be read from your planning system, processed by the automatic time series forecasting, and then written back to the original source or elsewhere. The human expert can then adjust these forecasts if additional information is available. Implementing automatic time series algorithms for accurate predictions is straight forward. The benefits to your organization are like low-hanging fruit.
Choosing the best forecast: Algorithmic precision vs. human insight
Algorithms are often more accurate at predicting outcomes than human experts. Let us assume that you have a thousand time series that you need to forecast monthly two years into the future. With such a large amount of data the likelihood of human error increases and the job is hardly inspiring.
There may be a temptation to just copy and paste last year’s data. Sometimes this is because there isn’t enough time for a detailed analysis, but sometimes it really is the best possible forecast. Surprisingly, often the best prediction is simply copying and pasting the latest observation. But often a more complex mathematical model is needed to create the optimal forecast and maintain predictive accuracy.
The problem is that it is not easy to say what the best choice is, and it takes a lot of work to determine it. However, an algorithm can quickly train multiple models based on historical data and run tests to compare their accuracy. Based on these tests, the algorithm decides which approach to take. By using such an algorithm, you get a detailed analysis for each time series each time you run the forecast.
If you would like some technical information about time series forecasting, check out this article.
The indispensable role of experts in automated forecasting
It is important to note that there are circumstances in which additional expert input remains invaluable. You might already know, for example, that one of your two production lines will need to be shut down in a year’s time. This information will need to be manually inputted because the algorithm will not be able to pick it up from the historical data available to it. An algorithm is a tool that experts can use to generate better forecasts, faster than before, allowing you to make more productive use of your time.
Automatic time series forecasting can also be used to exploit known interdependencies between different variables. Additional time series based on forecasts drawn up by human experts are a classic example of this. Let us say you want to forecast energy consumption at a production facility. A time series on your planned production volumes can be added to the algorithm. This allows the algorithm to consider the historical data presented to it while also taking account of the variation you are expecting in your production volume.

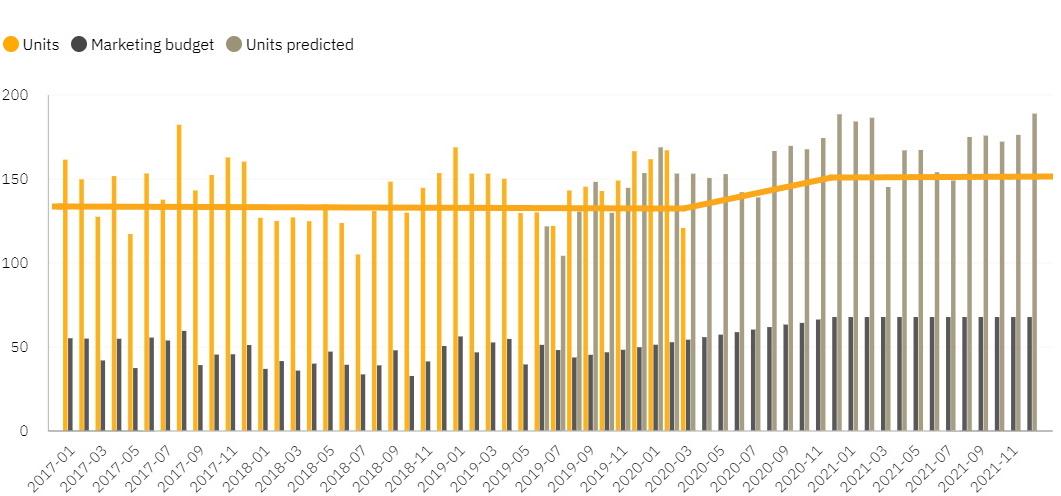
The human expert can tell the algorithm about causality between marketing budget and bread sales. The algorithm then looks for correlation and uses planned marketing budget as additional information.
What kind of data is needed for automatic time series forecasting?
To perform automatic time series forecasting you’ll need a sequence of datapoints in time order. If the time series you are using contains seasonal variation, it is desirable to have a minimum of two seasons’ worth of historical data. For example, to predict future monthly temperatures, at least two years of monthly data would be preferable. The more data you have, the better.
In some circumstances, even time series that do not have direct historical data can be forecasted. This is an option when historical data is available through other relevant time series. For example, you might have data on past fuel purchases, but you want to forecast your fuel consumption. If you make large one-time fuel purchases, but your consumption is steadier, you can use the moving average method to forecast your consumption. This allows you to account for seasonal variation and trends, but the forecast is not unduly affected by whether the purchase was recorded at the beginning or end of the period.
Summary
By leveraging sophisticated algorithms, businesses can navigate the vast seas of data, uncovering patterns and trends that were once obscured by the limitations of human intuition and the sheer scale of information. Automatic time series forecasting not only helps you to forecast better, it also means less grunt work and more opportunities to act on the results. Choosing the best forecast is not merely a technical decision; it’s a strategic one that can significantly impact the outcomes of decision-making processes. Implementing a time series forecasting solution is relatively straightforward, and it is an excellent introduction to algorithmic analysis.
Latest articles
Enhance your company’s capabilities with Intito’s expert solutions and services. Our dedicated team is here to assist you in moving your business forward. Fill out the form to book a consultation today!


